QC Lab Benchmarking

Introduction
Model
Report
Benefits
Data-Privacy
Contact

Quality Control Lab Benchmarking

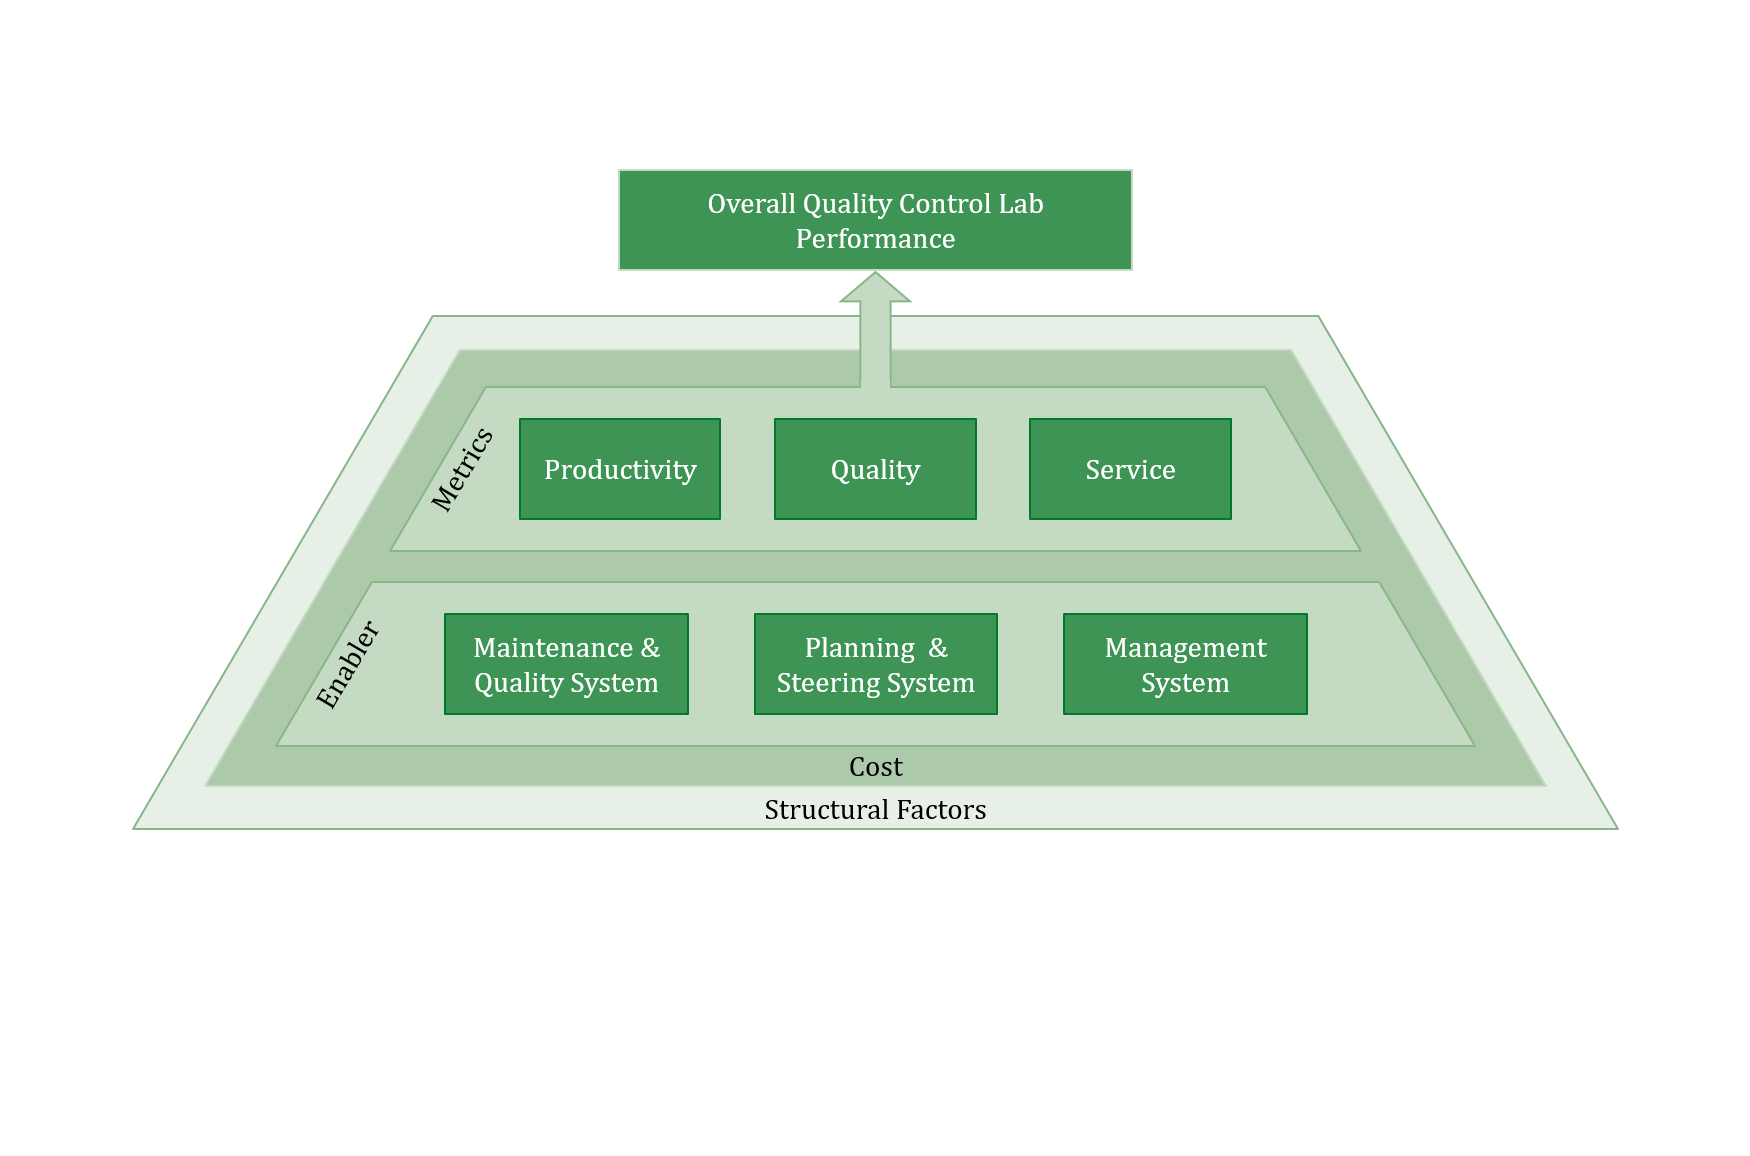
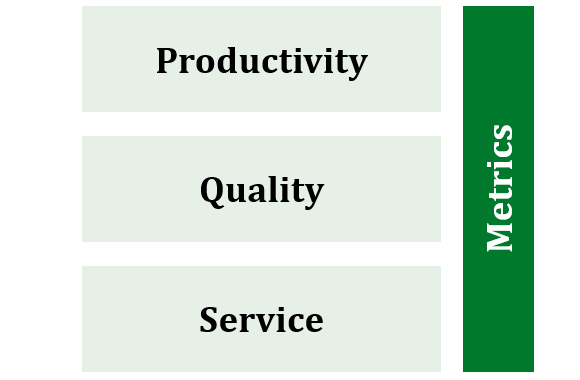
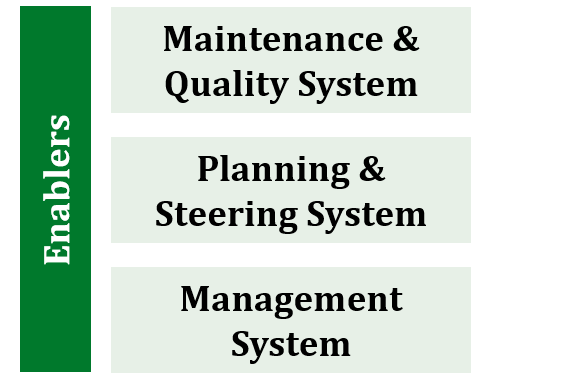
The QC Lab Benchmarking helps to assess your Operational Excellence (OPEX) Performance and Maturity in the Quality Control (QC) Lab. With the industry-tested holistic approach of the St.Gallen OPEX Benchmarking we ensure a meaningful assessment of your QC Lab. We refined the St. Gallen OPEX Benchmarking model to suit the requirements of the lab environment. The refinement comprises new performance categories that address the objectives within a pharmaceutical lab. Lab-specific operationalized KPIs as well as a revision of all enablers was conducted as part of the refinement. The enablers serve as an OPEX maturity assessment for the lab and help to understand performance gaps.

The benchmarking was developed in 2016 together with leading pharmaceutical companies to ensure feasibility and usefulness of the outcome. In 2020 the benchmarking database already reached more than 100 QC Labs from all around the world that can be compared.

The Quality Control Lab Benchmarking Model

The QC Lab Benchmarking Model helps to structure the benchmarking questionnaire and serves as a framework for the lab assessment. The visualization of the Model provides an overview about the two-fold approach of QC Lab Performance. The Model encompasses lab performance for the categories productivity, quality and service (top section). In addition, the enabler implementation level allows an assessment of the lab maturity (bottom section). Cost and structural factors provide an embedding in order to derive cost efficiency and to be able to compare similar labs to each other. Based on structural factors individual filters can be applied to build an individual peer group for the participant.

QC_Lab_Model_Benchmarking_Bild_website1
1/1

Outline on Key Focus Areas of Benchmarking

Metrics

Productivity

The section of productivity metrics describe how efficient the lab is doing their job. Furthermore, insights on utilization and usage of synergy effects are disclosed. (Example of KPIs: Handled Samples/QC FTEs, Batches processed/QC FTEs, ...)

Quality
The quality metrics section outlines how effective the lab is doing their job. Selected metrics allow to derive conclusions about the process and product quality. (Example of KPIs: Lab Deviations/1’000 Tests, Analytical Right First Time, ...)

Service

All service metrics enable to monitor both the lab processing speed as well as the adherence to the target schedule.  (Example of KPIs: Lead Time, Cycle Time, ...)


QC_Lab_Benchmarking_Bild_Metrics_new
Enablers

Maintenance & Quality System

The Maintenance & Quality System comprises enabler focusing on the categories: Maintenance, technology assessment, housekeeping, process management and standardization & simplification.
Planning & Steering System
The Planning & Steering System comprises enabler focusing on the categories: Set-up reduction, pull approach, layout optimization, planning adherence and visual management.
Management System
The Management System comprises enabler focusing on the categories: Management commitment & company culture, employee involvement & continuous improvement and functional integration & qualification.
QC_Lab_Benchmarking_Bild_Enablers
Personalized Comprehesive Report
The personalized benchmarking report shows your relative performance compared to your peer-group and High Performer. A Management Summary will be provided that gives relevant insights on Productivity, Quality and Service Performance and Enabler implementation level. Heat maps show your relative performance for all KPIs compared to your peer-group median and High Performer. Furthermore, a detailed overview of structural factors of your lab compared to peer-group will be provided.Additional charts illustrating selected efficiency distributions (e.g. cost and headcount).
 

Increased Granularity
The split into different testing categories in a comprehensive set of tasks performed (e.g. raw material testing) in a pharmaceutical quality control lab allows to build meaningful comparisons between labs with the same testing categories.

QC_Lab_Model_Benchmarking_Bild_Report_2p_website

Determine Lab Productivity, Quality and Service Level
Compare your performance value for each category to the relevant peer-group. Gain insights on the peer-group median and the value of the Top Quartile labs regarding Overall Lab Performance.


Enabler Implementation Level
Degree of detail on the different fulfillment levels for each enabler ensures consistency. Furthermore, it provides a precise outline for participating companies on their operational excellence effort and activities in their lab.


Example Report
An extract of a dummy report is available to get a first impression of the project outcome. You can access the report  here.

QC_Lab_Model_Benchmarking_Bild_Report_3p_website

Benefits of Your Participation

  • Assessment of OPEX Performance and Maturity of your QC Lab.
  • Personalized peer-group from St.Gallen QC Lab database.
  • Personalized benchmarking report showing your relative performance compared to your peer-group and High Performer.
  • Participating with more than one lab of the same peer-group enables you to learn from each other.
  • Support on-going lean lab activities with data-backed findings from personalized report.
  • Get access to St.Gallen research findings based on statistical analysis of aggregated data from QC Lab database.

Data Security and Privacy

The benchmarking project will be conducted in accordance to the International Benchmarking Code of Conduct which ensures a correct attitude of all participants. The company data will be handled with utmost discretion and if applicable will be made anonymous. Company specific data is not to be used without prior approval of the respective company. The project initiators reserve to themselves to use the project results in summary and blinded for publications.

Workshop

We are happy to conclude the benchmarking excercise with an optional on-site workshop. Conducting a workshop allows to discuss the benchmarking results in detail and derive improvement actions based on our extensive experience. The individual benchmarking results will also be linked to current research findings on performance & enbler patterns in QC labs. 

Get in touch

In case you are interested in participating in our QC Lab Benchmarking, please do not hesitate to contact us.

Lorenzo Pirrone
Lorenzo Pirrone
Research Associate & PHD Candidate
Jessica Helbling
Jessica Helbling
Research Associate & PhD Candidate